This One Chart Says Gold Prices Could Hit $2,100.
Gold Prices Could Be Setting Up to Soar
There’s one chart that says gold prices could be setting up to make a move towards $2,000 and beyond.
Please look at the chart below. It plots the monthly gold price. Also, pay very close attention to the black lines drawn on the chart.
Advertisement
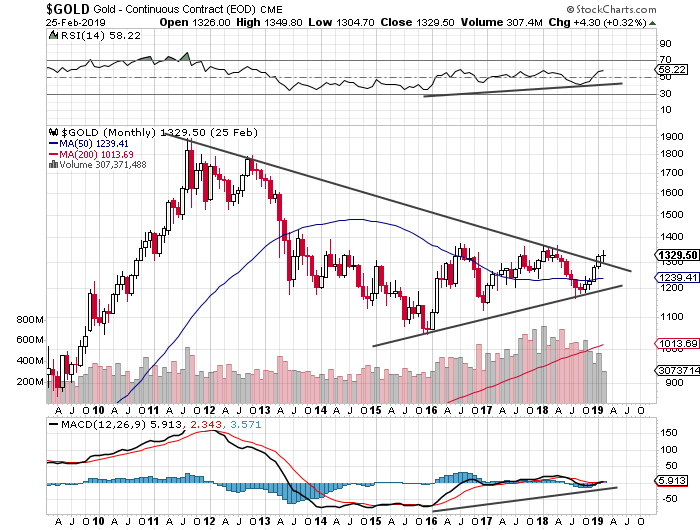
Chart courtesy of StockCharts.com
Over the past few years, on the gold price chart, we have seen the formation of a chart pattern called a “symmetrical triangle.”
A symmetrical triangle forms when there is a preceding downtrend and a developing uptrend. Usually, the price is consolidating (the trading ranges are getting smaller) when this happens.
A symmetrical triangle isn’t a bullish or bearish pattern. You can only tell where the price will move once it breaks out of the triangle.
If the price breaks above the triangle, an upside move usually follows. If the price breaks below the triangle, a downside usually comes next.
Thanks to the move over the past few months, the gold price has broken out of the triangle.
As gold prices moved higher, momentum indicators like the moving average convergence/divergence and the relative strength index indicators trended higher as well.
Remember, without momentum, you really can’t do much.
These two momentum indicators are suggesting that the momentum is in favor of the buyers. The buyers are increasing in number, controlling the price. And they could take it much higher.
At the very least, this is all very bullish for gold prices.
How High Could Gold Prices Go?
When it comes to technical analysis, there are some guidelines on where the price could go after there’s a certain trigger. And with a symmetrical triangle, there are targets as well.
Technical analysts usually take the widest part of the triangle (the price range) and add it to or subtract it from the breakout point, depending on whether the price broke above or below the triangle.
In the chart above, there are two instances where the widest part could be used.
First, the price action between late 2011 and late 2015—that’s roughly $800.00.
Second, the price action between early 2016 and late 2017—that’s about $300.00.
In the chart above, the breakout level is around $1,300.
If you want to be skeptical, then add $300.00. With this, gold prices could reach as far as $1,600. That is 20% above the current gold price.
If you want to be generous, then add $800.00. This takes gold prices to as high as $2,100. That is 58% above the current gold price.
This Is Where You Could Make Stellar Returns
Dear reader, I have publicly said that gold miners could be the next millionaire makers. I still believe this.
It must be understood that gold mining stocks provide leverage gains to gold prices. A one-percent increase in precious metal prices could mean a five-percent increase in some mining stocks.
Consider the charts below to get some perspective on the leverage that mining stocks provide to gold prices:
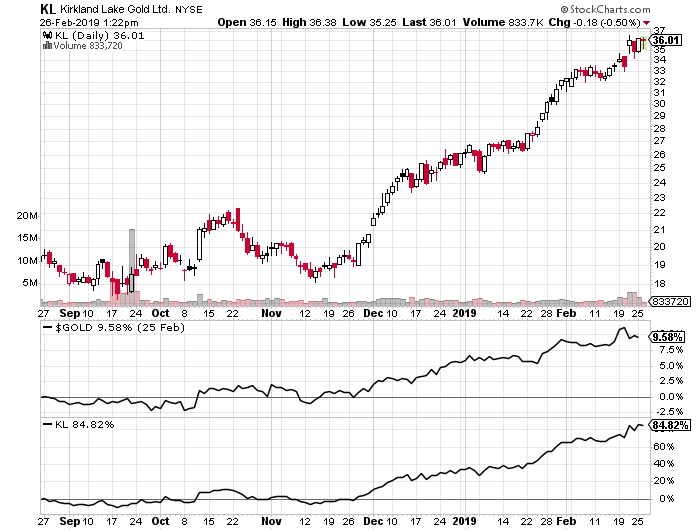
Chart courtesy of StockCharts.com
Kirkland Lake Gold Ltd (NYSE:KL) increased by 84.82% in the past six months as gold prices increased by 9.58%. So for every one-percent increase in gold prices, KL stock increased by 8.85%.
If gold prices increase by even 20% from their current levels, it wouldn’t be shocking to see a number of gold mining stocks double in value, if not more.
Stewart Thomson: The Trade Deal Is GREAT NEWS FOR Gold
The biggest driver of the markets right now is the possibility of a US-China trade deal, and Stewart explains why the deal will be great for gold…
Graceland Updates 4am-7am
Email:
Feb 26, 2019
- The biggest driver of major markets right now is the possibility of a US-China trade deal.
- On that note, please click here now. The US government’s wild launch of tariff taxes caused global markets to swoon in the first half of 2018. Gold and the Chinese stock market were hurt more than a lot of other markets.
- Gold has done well with QE, QT, falling rates, and rising rates, but tariff taxes hurt the Chinese economy. That put a damper on the growth of Chinese gold demand.
- The Chinese stock market is now rallying in anticipation of a trade deal, but even if there is no deal (unlikely), the Chinese government has embarked on a significant stimulus program.
- US money managers are getting more interested in the Chinese stock market because of that stimulus. A trade deal that includes more intellectual property protection would create a huge US stock market rally. More importantly, it would create a huge rally in the Chinese market and that would increase gold demand significantly.
- If the Fed hikes or signals that QT is going back to auto pilot mode, institutional money managers will buy gold because of growing concerns about the US government’s ability to finance itself, and because the Fed’s move would hurt low interest rate loans for US stock market buybacks. A situation like September 2018 would occur, with gold rallying and stock markets tanking.
- On the other hand, a pause in hikes and an earlier-than-expected end to QT is also viewed as good news for gold.
- Additionally, even without a trade deal, China’s economy is becoming consumer-oriented, and that means more imports and less exports. In turn, that means less need for the purchase of US government debt.
- A trade deal would speed up this process.
- The US government’s ability to finance itself without foreign government purchases of its bonds is becoming a significant concern for powerful money managers like Larry Fink of Blackrock.
- The bottom line: A trade deal is good for stock markets and gold, but it likely flips the US government’s financial situation out of the fry pan… and into the fire!
- Clearly, the current global-macro situation is extremely positive for gold. What about the technical situation? For the answer to that question, check out this daily gold chart.

- It really doesn’t matter whether gold makes a beeline for my new $1400 target immediately, or whether there’s a “pitstop” in the $1300-$1280 support zone.
- It doesn’t matter because the big picture fundamentals and technicals are outrageously positive, so there’s no need for fear amongst investors.
- Please click here now. Double-click to enlarge. The higher-price implications of the technical action on this weekly gold chart are obvious. The $1000/ounce price zone is major support, $2000 is resistance, and $3000 is the target price!
- The world’s need for dollars is declining, for a multitude of reasons. Please click here now. Whether it’s caused by the simple but gargantuan growth of the Chinese and Indian economies, or the US government’s “My way or the highway” approach to sanctioning Russia, bank and government entities around the world are steadily distancing themselves from the dollar.
- Gold is the best way for individuals, banks, and governments to do that. The buy programs of emerging central banks are only in their infancy, and the tonnage being bought is consistently rising.
- As somebody who aggressively bought the US stock market right into the October 2008-March 2009 lows, I can assure the Western gold community that there is no event to fear in the current gold market. The market is rock-solid.
- The rise of the Eastern economies is a titanic force that is creating both de-dollarization and demand growth for gold. Citizens of the East view gold as the best investment asset from both a risk and reward perspective. Their view is now being adopted by more and more Western money managers. In time (and not much time), this positive view of gold will also be the view of the average American citizen. Gold bashers like Warren Buffett prospered in the fiat era, but that era is waning fast. A new bull era is being born and all roads lead to gold.
- Please click here now. Double-click to enlarge this interesting GDX chart. Merger-mania is underway in the gold and silver mining stocks and there’s “bull flag mania” on the daily GDX chart!
- Larger gold mining entities are required to service the global demand growth for gold. I’ve predicted that Chinese miners, banks, and industrial companies will ultimately be involved in mergers with Western mining companies.
- In the coming years, gold miners could become as important as the giant base metal miners.
- Please click here now. Double-click to enlarge. That’s another look at the GDX daily chart, with the support zones highlighted. Mining stock enthusiasts should be buyers of their favourite miners any time GDX trades at a support zone.
- Gold stock investors should understand that the current market is not like the early 2000s, 2007, or 2016. This is a market like the 1970s, and the upside fun… has only just begun!
As the world edges closer to the next crisis, today the man who has become legendary for his predictions on QE and historic moves in currencies spoke with King World News about one man’s adventure in stocks and when the real fireworks in the gold market will begin.
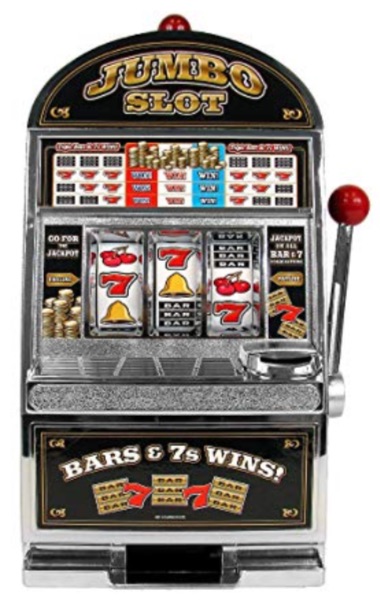 Casino Of Slot MachinesFebruary 24 (King World News) – Egon von Greyerz: Imagine a casino full of slot machines that all guarantee a constant high return. All you need to do is to put in a bit of money and you will get an incredible income stream for life…
Listen to the greatest Egon von Greyerz audio interview ever
by CLICKING HERE OR ON THE IMAGE BELOW.
by CLICKING HERE OR ON THE IMAGE BELOW.
 Sponsored
Stock Market Investor, Alfred
Egon von Greyerz continues: “Well, this is exactly what the stock market is, namely a remarkable slot machine with a continuous flow of guaranteed payouts. No skill is required, and relatively little money. And the wonderful thing is that you don’t even need to be lucky since the machine just continues to spew out money without the need for either a strategy or dexterity.
Egon von Greyerz continues: “Well, this is exactly what the stock market is, namely a remarkable slot machine with a continuous flow of guaranteed payouts. No skill is required, and relatively little money. And the wonderful thing is that you don’t even need to be lucky since the machine just continues to spew out money without the need for either a strategy or dexterity.
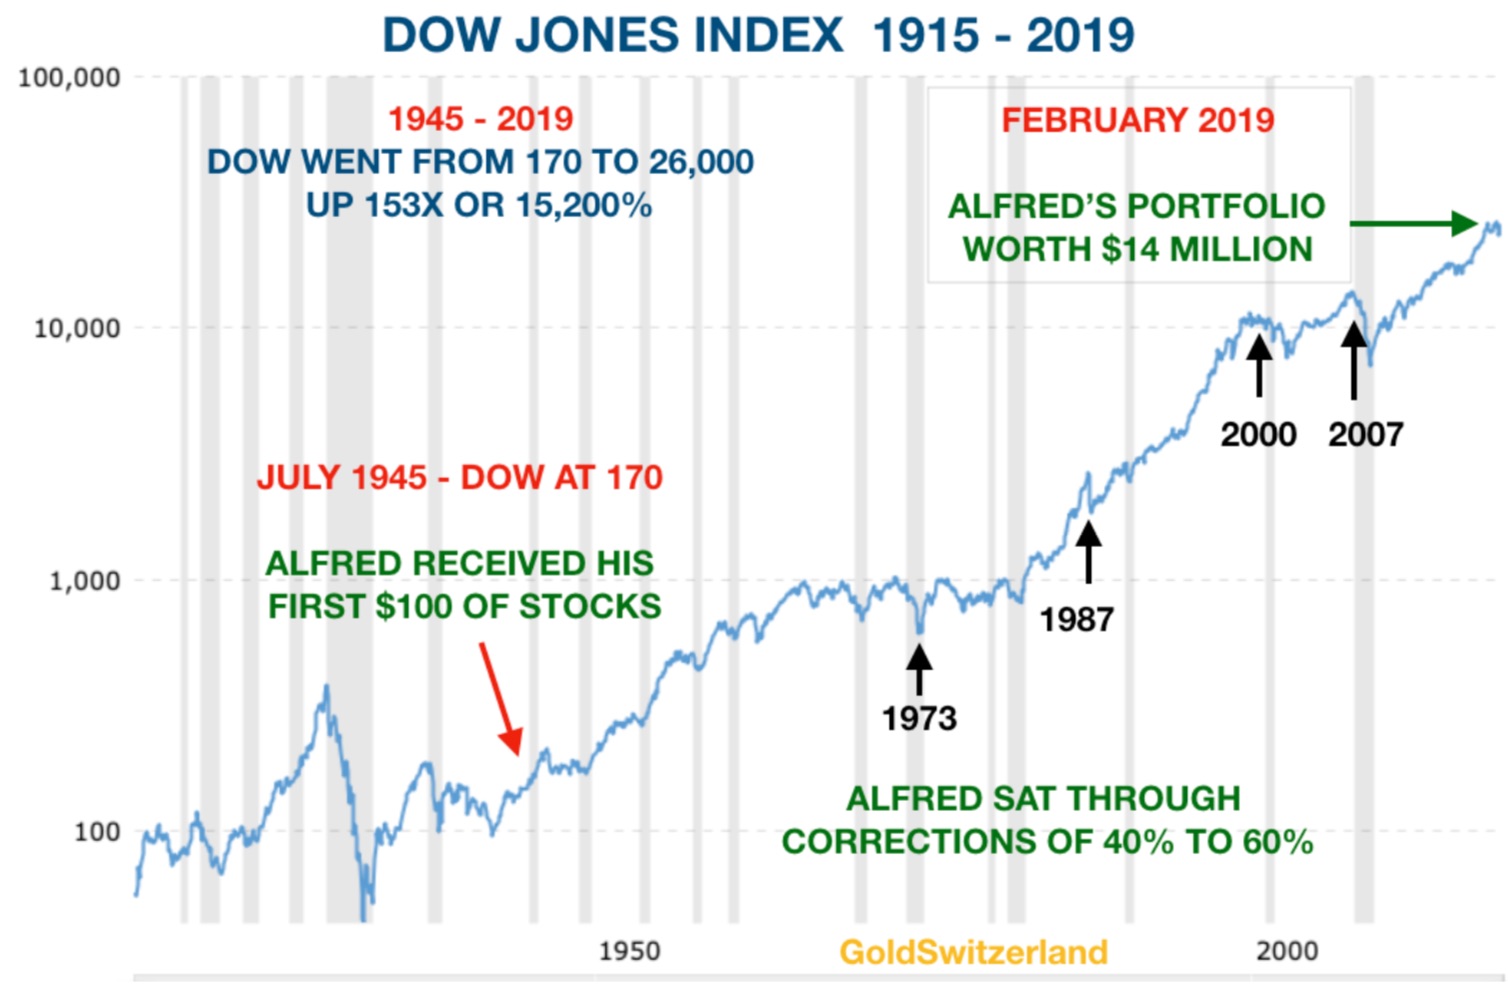
Why should we time the stock market when it works so well for us. Let’s take the example of a stock market investor called Alfred who was born at the end of WWII and is now 74 years. At his birth, his grandparents gave him $100 of stocks in the Dow Jones index and between the parents and grandparents $10 was saved monthly to buy stocks for Alfred. All the money went into Dow stocks and dividends were reinvested.
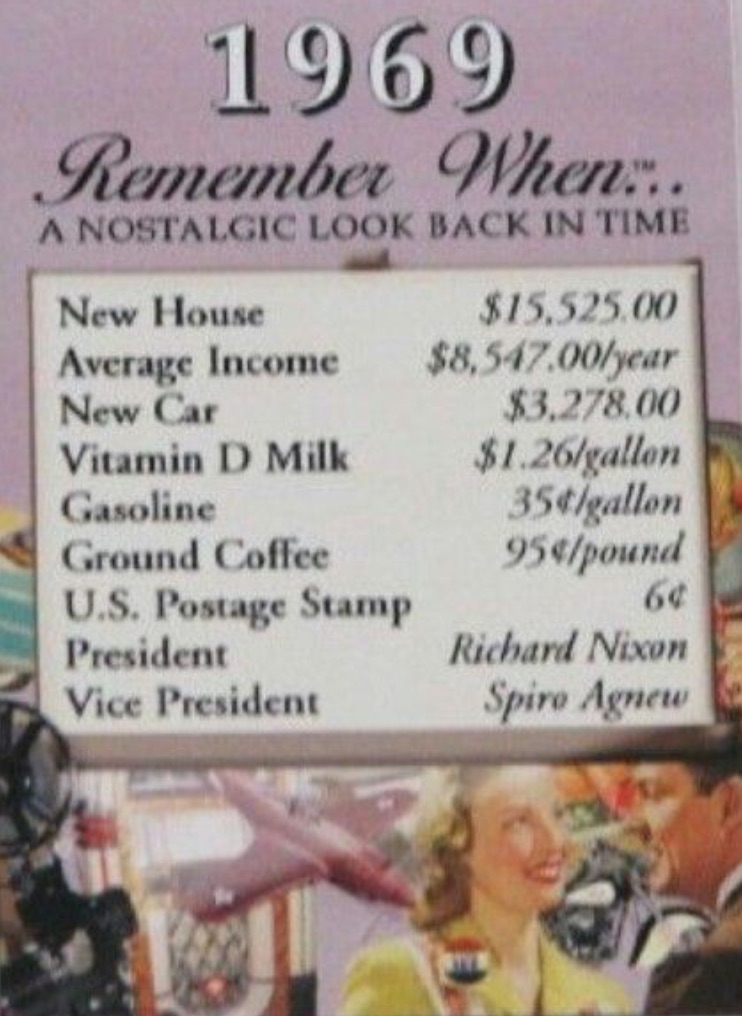
By the time Alfred was 24, in 1969, he started working and earned a good salary since he had an excellent education. So he could save $250 per month. Ten years later Alfred had done well in his career and could save $2,000 per month until his retirement at 65 in 2010. His investment account had by that time grown to $6.7 million. He continued to be fully invested in the market from 2010 and saved $1,000 per month of his pension until today. By February 2019, Alfred has amassed a stock portfolio worth $14 million. Alfred had excellent tax advisors so he could avoid capital gains taxes or other taxes on his investments.
The total savings of Alfred’s parents, grandparents and his own amounted to around $1 million over a 74 year period which all went into stocks. Most of it was Alfred’s own savings from his work. The stock market looked after Alfred and his savings very well so that he managed to grow the money invested 14x from $1 million to $14 million. Alfred naturally considered himself to be a very talented stock investor but his luck was that no talent was required nor market timing since Albert only bought the Dow Jones Index.
So far so good. Alfred has done extremely well in the stock market in spite of some hair raising market falls. During this period Alfred had to suffer some major paper losses like in 1973-4 when the market lost 40% or in 1987 when the market had a similar fall of 40%. But Alfred was never worried since his experience was that stocks always go up. Alfred was a Permabull.
Again in 2000-2 Alfred suffered a 40% fall and then in 2008-9 came the Great Financial Crisis and Alfred had a 60% paper loss. But since markets always go up, Alfred had no reason to worry. And again he was right since the market continued to go to new highs.
Alfred is now 74 and thanks to his grandparents’ and parents’ wisdom, which was passed onto him, amassed a considerable fortune of $14 million. Alfred knows that he is not going to spend all that money so it will pass over to his children and grandchildren.
During his 74 year life, Alfred has probably outperformed 99% of all stock market investors. And he has had no mean competition. Especially since the late 1980s, the investment industry had become extremely sophisticated, using high powered computers, rocket scientists, high frequency trading and very complex financial instruments or derivatives. The asset management industry has built up a massive cost structure consisting of grossly overpaid staff with very expensive systems and infrastructure costs. But even with all these costly state of the art systems, the industry has been underperforming Alfred and any other index investors.
So who is paying for these massive costs and especially the bonuses in the hundreds of thousands, millions or even tens of millions that many of the people in the industry are earning? The costs obviously reduce the returns that the investors earn and in the end these costs are paid by ordinary people such as fund holders, pension fund members, or other institutional investors.
These costs reduce the return over time dramatically and virtually no fund manager will have achieved the returns that Alfred did. Thus, there is a massive industry that has been created which only lines its own pockets at the expense of ordinary people. If we just take the example of the 2007-9 crash, we know that most investment banks would have gone bankrupt without a massive rescue package by central banks to the tune of $25 trillion including loans, credit lines and guarantees. In spite of this, staff at these banks got the same substantial bonuses in 2008 as in 2007, from banks that only survived due to government assistance. Thus, bank profits line the pockets of the bankers while losses are picked up by the state which means ordinary people.
Coming back to Alfred, he has had such a good run so should he now be concerned that he and his family will lose it all. Has he just been lucky or is he a very shrewd investor. He realizes that it is not really his clever investment skills that have got him where he is today. He has never selected a single stock in his life since he has just invested in the index. Nor has he ever analyzed a company or the state of the market. As Alfred says: “After all, investing is so simple, you just buy and hold and the market will do all the work for you.” And who can argue with Alfred. He started with $100 and now has $14 million.
Alfred Never Asked Himself
So Alfred will hold on to his wealth in the stock market whatever happens? Alfred is not concerned about all the risks in the market. His 74 year old investment career has included many downturns but the market has always recovered. Alfred has never asked himself if he has just been lucky to live during an extraordinary bull market cycle, fueled by credit expansion and money printing.
So Alfred will hold on to his wealth in the stock market whatever happens? Alfred is not concerned about all the risks in the market. His 74 year old investment career has included many downturns but the market has always recovered. Alfred has never asked himself if he has just been lucky to live during an extraordinary bull market cycle, fueled by credit expansion and money printing.
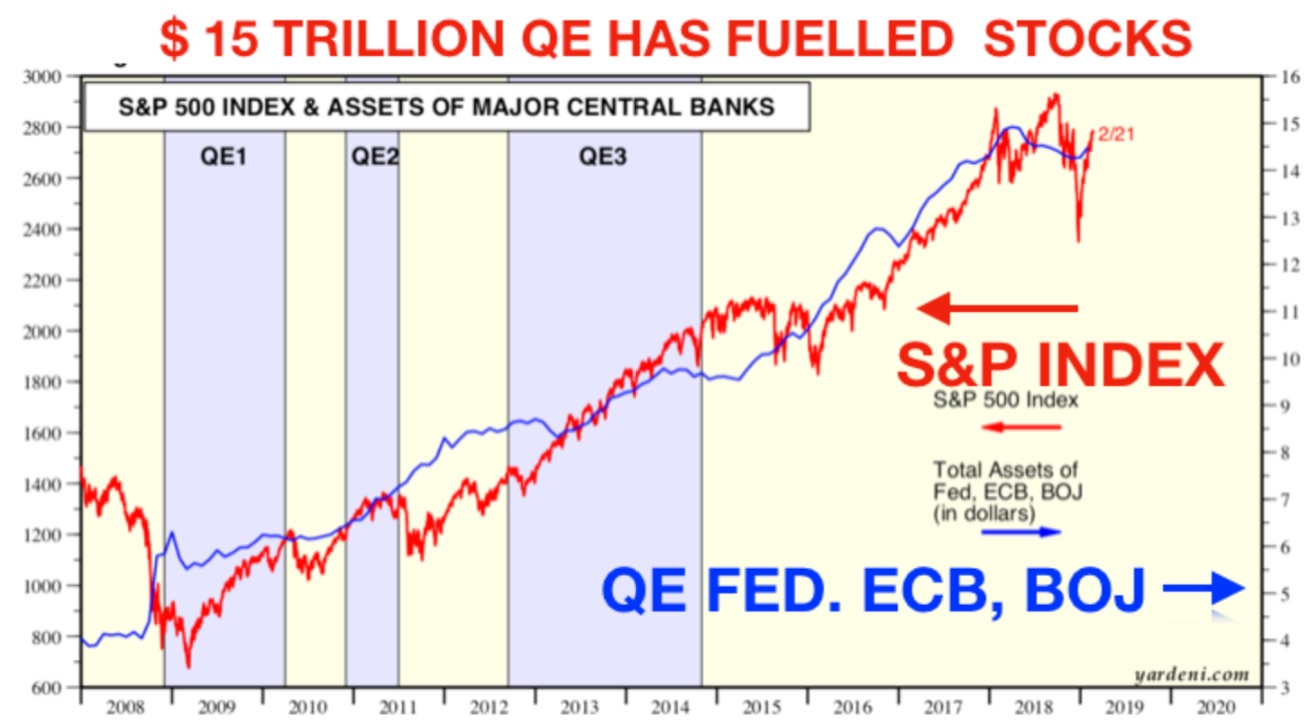
He has for example never looked at the graph below and considered that there is a direct relationship between Central banks money printing and the stock market. Since the bottom of the market in 2009, $14 trillion have been printed by the Fed, ECB (European Central Bank) and the BOJ (Bank of Japan). Alfred has never thought that this substantial liquidity might have been the reason why the market is up 4x since 2009.
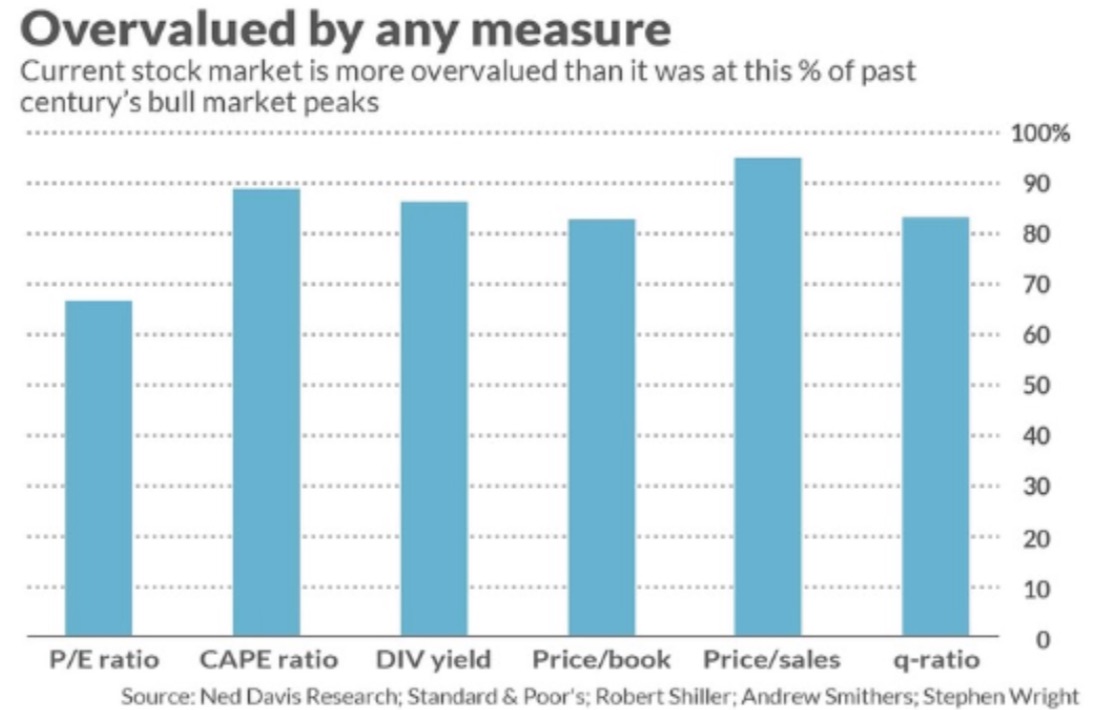
But there are also other red flags that Alfred could look at to determine the risk level of the market. These are ratios like P/E ratio, Shiller’s CAPE ratio, dividend yield, Price to Book ratio, Price to Sales and the Q ratio which is dividing market value by replacement cost of assets. All these ratios indicate that the current market is more overvalued than it was in most of the 36 bull market tops in the last 100 years.
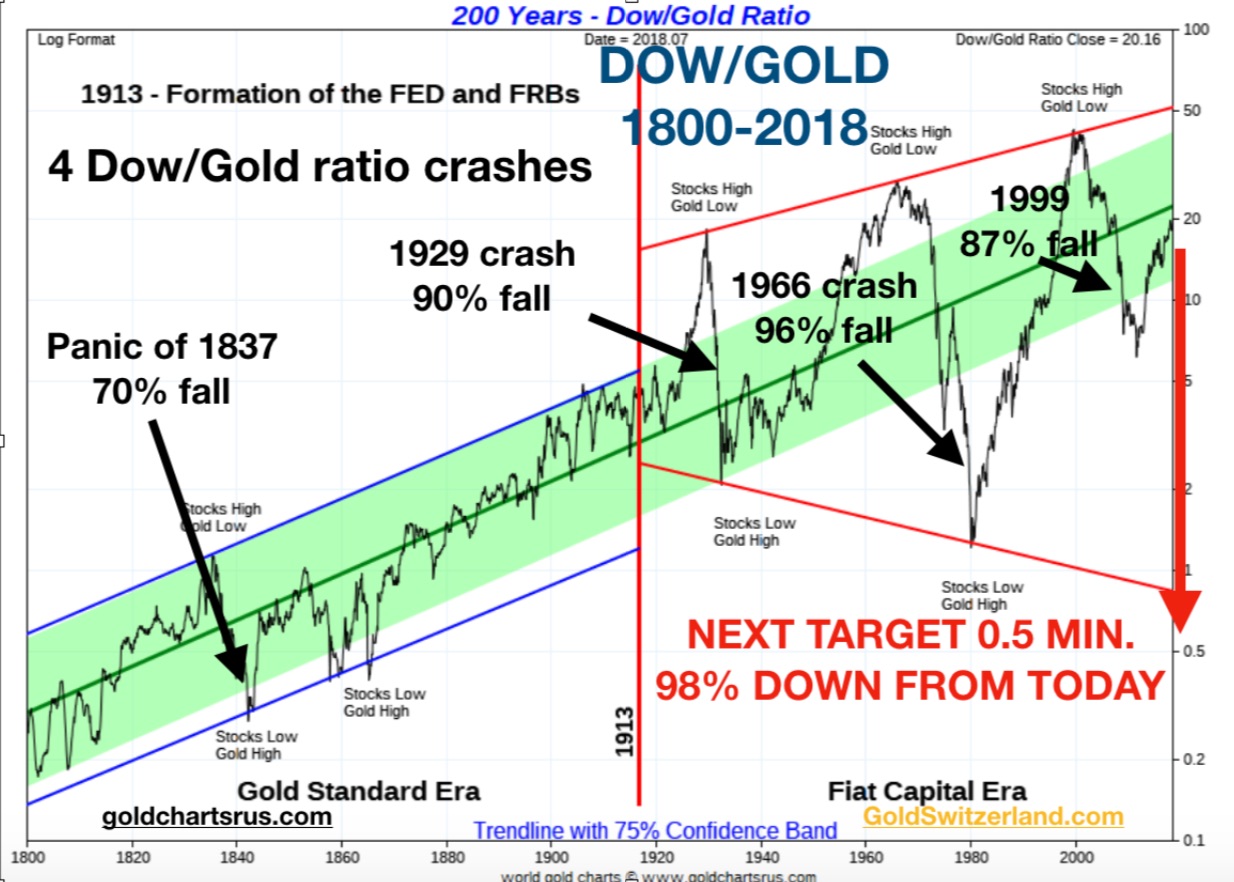
What Alfred doesn’t realize is that the stock market already turned down in real terms in 1999. Between 1999 and 2011, the Dow fell 88% against gold. Since then we have seen a correction up in the ratio and the Dow is now “only” down 55% since 1999. But the correction up of the Dow/Gold ratio is likely to finish in 2019. In 1980 this ratio was 1 to 1 which means that 1 Dow unit was equal to 1 ounce of gold. They were both around 800 at the time.
74 Years Of Savings Could Disappear
The next decline of the Dow/Gold ratio is likely to reach 1/2 which means a further fall of 98% from here. If that is correct, Alfred will lose 98% of his stock portfolio in real terms which is against gold. Thus 74 years of substantial savings could all disappear in the next 4-6 years.
The next decline of the Dow/Gold ratio is likely to reach 1/2 which means a further fall of 98% from here. If that is correct, Alfred will lose 98% of his stock portfolio in real terms which is against gold. Thus 74 years of substantial savings could all disappear in the next 4-6 years.
Alfred will not be the only one to suffer such huge losses. He will be joined by most investors. Because very few will understand why the market this time doesn’t go up as it always has. For the first time in his investment life, Alfred could have benefitted from some understanding of risk and wealth preservation but sadly it will be too late for him. And this is how we will see the biggest wealth destruction in history, bursting the asset and debt bubbles of the last 100 years. Most people will not realize what has hit them until it is too late.
The Best Insurance
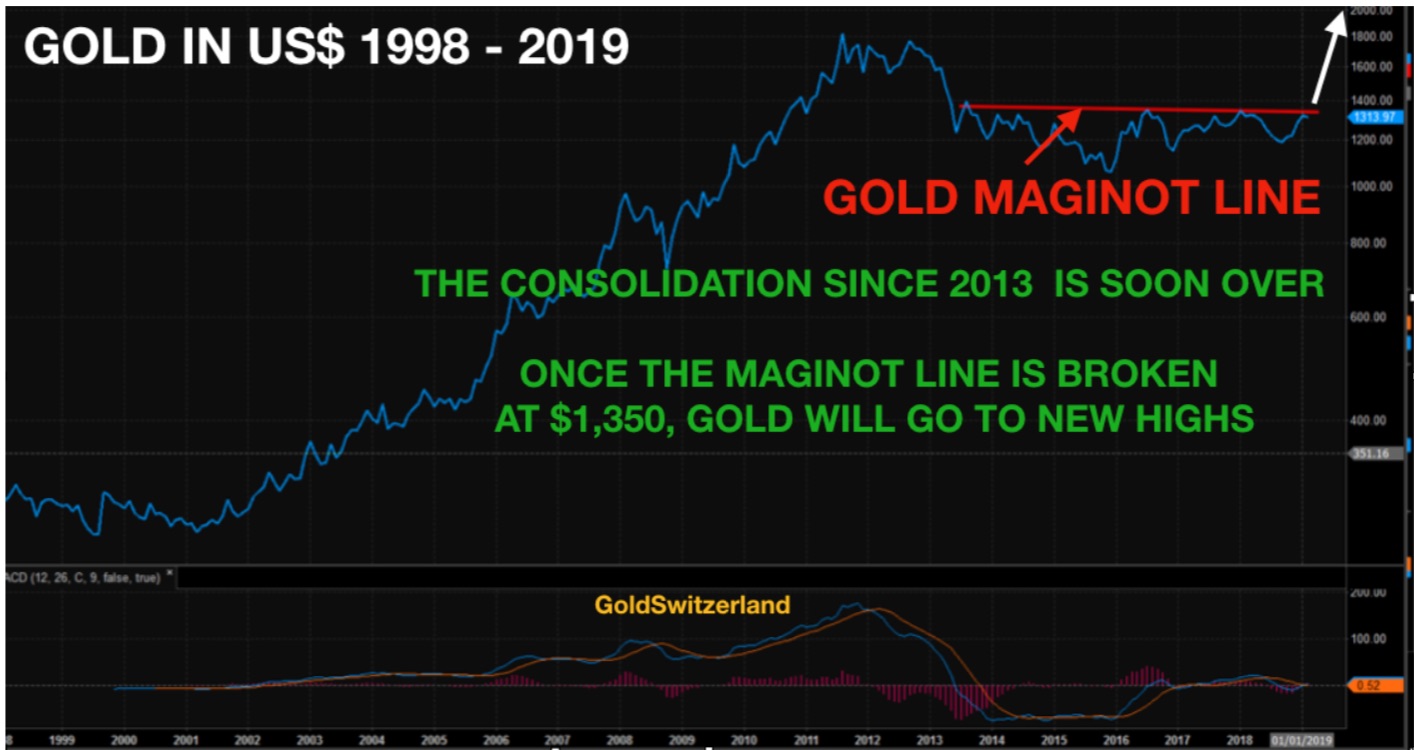
To own physical gold and store it safely outside the banking system is the best insurance against the coming calamity in world markets. Short term, gold in US dollar has attacked the Maginot line around the $1,350 level. This line has been broken by gold measured in many other currencies but not yet in dollars.
To own physical gold and store it safely outside the banking system is the best insurance against the coming calamity in world markets. Short term, gold in US dollar has attacked the Maginot line around the $1,350 level. This line has been broken by gold measured in many other currencies but not yet in dollars.
The Real Fireworks In The Gold Market
The Maginot line is extremely strong and therefore we might see a few attempts before the price breaks through. Thus we could see a minor correction down from current levels, which would give investors a superb opportunity to acquire gold and silver at prices that will never be seen again. The real fireworks will start once gold has decisively broken the Maginot line.…For those who would like to read more of Egon von Greyerz’s fantastic articles CLICK HERE.
The Maginot line is extremely strong and therefore we might see a few attempts before the price breaks through. Thus we could see a minor correction down from current levels, which would give investors a superb opportunity to acquire gold and silver at prices that will never be seen again. The real fireworks will start once gold has decisively broken the Maginot line.…For those who would like to read more of Egon von Greyerz’s fantastic articles CLICK HERE.
KWN has now released one of the greatest audio interviews ever with Bill Fleckenstein and you can listen to it by CLICKING HERE OR ON THE IMAGE BELOW.
***Also just released: Louis Gave Of GaveKal Research Warns This Will Have Dramatic Consequences For The World And Global Markets CLICK HERE TO READ.


0 comments:
Post a Comment